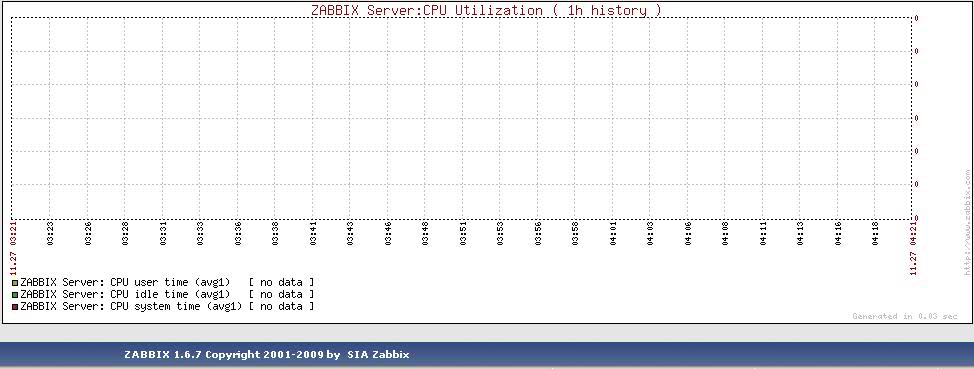
Zabbix, grsecurity: graph with no data
Sometimes zabbix creates empty graph with [no data] caption. However, in «latest data» there are some values with current timestamp, so it might seem like zabbix_server is gathering info properly. There might be nothing particular in log files also, which makes this problem quite difficult to resolve. This might be happening because of system running grsecurity patch which doesn’t allow zabbix and other users to read /proc filesystem.

Solution:
Create «special» group for users who can access /proc, or use wheel with GID 10 if your kernel is configured properly already.
# groupadd proc
# gpasswd -a zabbix proc
# gpasswd -a admin proc
# getent group | grep proc
proc:x:1001:zabbix,admin
Write down new GID, in this case it’s 1001.
Reconfigure your kernel.
Grsecurity (Security level custom) → Filesystem Protections (Y) → Proc restrictions(Y) → Restrict /proc to user only (N) → Allow special group(Y) → GID for special group.
#
# Filesystem Protections
#
CONFIG_GRKERNSEC_PROC=y
# CONFIG_GRKERNSEC_PROC_USER is not set
CONFIG_GRKERNSEC_PROC_USERGROUP=y
CONFIG_GRKERNSEC_PROC_GID=1001
CONFIG_GRKERNSEC_PROC_ADD=y
If your kernel was configured properly at first, but CONFIG_GRKERNSEC_PROC_GID was set to 10, then adding zabbix user to wheel and restarting services should be sufficient, no reboot is required.
Otherwise rebuild kernel and reboot. Data should be collected and displayed properly by now.